
DREAMT: The Six Pillars of Scaling a Company
Dany turned to us and said with a knowing look, “The first two parameters that help us measure a company’s valuation are one, its growth rate, and two, the quality of its management.” He watched us for a long time before adding, “You meet both conditions. So, I suggest that we now study the nature of your product and the typology of your customers.” The man is an associate partner in a renowned venture capitalist firm in London. He was meeting us that day to discuss his interest in investing in the company that I was representing (CHD).
At this point of the discussion, I decided to abandon my PowerPoint presentation and draw a symbol on the board. The rep- resentatives of P-Equity weren’t really used to entrepreneurs not following the expected tone and the standard format usually used in such presentations. So, it was with increasing surprise that Dany and his partner watched me sketch a biblical shape in the middle of the blank page. They gradually recognized the branches of a can- delabra, a three-thousand-year-old symbol…
There was silence in the room until I said,
“We’re totally in tune with you. Aggressive growth and robust management are indeed two essential pillars of any scalable business. But in our philosophy, we also recognize four other essential conditions for generating exponential growth.”
I added to my drawing six letters, one above each branch of the candelabra. DREAMT. The participants listened to me attentively. What does the acronym mean?

D for Diversified Portfolio
The dynamics of scale require a certain upheaval of the old working methods. Scaling a company is like raising the roof of a three-story house in order to build a nine-story building. Both require very strong foundations without which the building may fall like a house of cards when the roof is raised.
In business, your existing clients are those well-built first floors. The intrinsic stability of the company is, therefore, a major asset to a successful expansion. However, this stability necessarily requires a diversified client portfolio. In other words, a customer base that isn’t predominantly dependent on contracts with one, two, or three specific partners. Let’s be clear: all companies obviously have a flagship customer. For example, at CHD, the leader in food industry data, this used to be Pepsico, a long-standing customer for thirteen years. But it’s still important that the revenue generated by the corresponding transactions doesn’t represent too high a percentage of the company’s total annual turnover.
When Dany and his partner saw the histogram showing that each of our five biggest customers represent only 3 to 4% of our annual revenue, they looked happy and sat back even more comfortably…
Note: Scaling a company is like raising the roof of a three story house in order to build a nine-story building
R for Recurring Revenue
It bears repeating one last time, recurring revenue is the cornerstone of a scalable business. It is, by definition, much easier to grow when the business in question is based on contracts that generate an “automatic” revenue base, every single year. To illustrate this point, let’s take the example of a medical practice, an event company, and a communication agency. It’s difficult for them to triple their revenue in one year because their products (dental treatment, wedding planning, or the launch of an advertising campaign) are sold on an adhoc basis. Conversely, technology companies have a distinct advantage: they are generally able to provide a subscription product that generates recurring revenue over years (a concept developed extensively in Part II).
When a graph appeared on the screen showing the evolution of our recurring revenue in one year (× 207 % !), Dany smiled even more. To obtain this excellent result, we applied the very concrete and reproducible methodology that I’ve just shared in the previous chapters.
E for EBIT
The term Earnings Before Interest and Tax is certainly a bit of a mouthful. It’s nonetheless an essential financial indicator. It is simply the net gain realized by a company at the end of the year, once all its expenses have been taken into account. EBIT is obviously linked to type of activity and varies by industry. That said, achieving 25% EBIT, a net gain equivalent to a quarter of the company’s total revenue at year-end, was a standard goal in the past.
But today, EBIT alone is no longer the only indicator that mat-
ters. Otherwise, how do you explain a company like UBER gener-
ating $3 billion in revenue in 2018 with $4.8 billion in expenses?
Can a company valued at $120 billion have a negative EBIT, or more simply put, a net loss? Well, yes! And this is one of the main principles to master when scaling. As we mentioned at the beginning of this book, in an aggressive growth phase, it’s important to prioritize the speed of growth over strict cost control. This principle is known as Blitzscaling and was developed by Reid Hoffman, founder of LinkedIn. In periods of exponential growth, there’s another rule that prevails. It’s called the Rule of 40 because the increase in revenue (in % compared to the previous year) and the EBIT at the end of the year (in % of total income) must combine for a total of forty. If, for example, revenues increase by 50% versus the previous year while EBIT is negative (and represents -10% of the current year’s revenues), the result of the increase in revenues (+50%) and the EBIT (-10%) nevertheless reflects an impressive growth curve (+40%).
A good EBIT is good. The Rule of 40 is even better.
A for Annual Growth
During the meeting, Edward, Dany’s business partner, confided in us, “What attracts us to you is the mix of styles: the stability of a family company managed in a responsible way mixed with a scale methodology supported by fiercely ambitious young entrepreneurs.”
For ten years prior to the scale period, our company showed an annual organic growth of 11%.
As they absorbed the information, Dany and Edward’s faces exuded serenity. An attempt to scale is riskier for a startup than for a mid-size company generating steady annual growth. In the worst case, the latter will return to its level of initial organic growth.
M for Market Sizing
In his excellent book Zero to One, Peter Thiel, founder of PayPal and Palantir, and an early investor at Facebook, shatters a myth that is still too common among entrepreneurs, CEOs, and investors. According to him, it’s much better to capture a large market share in a very small segment than to enter a huge market but have only a tiny share.
So, we drew up a list of our clients. They are extremely targeted and segmented. Dany and Edward were reassured again. Then we described our target market: technology companies in the food industry supplying restaurants. There are no less than three thousand potential customers for three hundred actual clients. These figures confirmed for our listeners that the exponential growth of a company necessarily depends on the size of the market that can be exploited in a highly segmented niche.
T for Team
The parameters mentioned above are just a dream without the last element. To DREAM (Diversified portfolio, Recurring revenue, EBIT, Annual growth, Market sizing), you must add a T. Dany was right, the management Team is a major criterion for success. Statistics prove it: 96% of business leaders generate up to $10 million in annual sales. Only the remaining 4% managed to scale.
In the first two chapters, we detailed the key profiles and cardinal values necessary for such an adventure. Recall the following: scaling up requires the transition from generalist to specialist profiles. In the same way that residents of a village can have several functions, a company’s original employees often wear several hats. But when the village becomes a city, its success depends on the level of expertise of each of its citizens. Here’s the first question to ask yourself when you want to scale a company: is every employee ten times better than all the other team members in the role they play on a daily basis?
Your Pilot’s Dashboard
Now that the conditions are in place, let’s take a look at the metrics that can help us measure performance. I count five, which can be put together in a dashboard for daily monitoring:
- ARR: This is the first axis of scale, and it allows you to check the robustness of your business.
- Customer retention: There’s no point in creating new sources of business if you keep losing existing ones.
- EBIT: You have to keep a close eye on this value because, in the end, it is indeed a profitable structure that you want to obtain.
- New Business: It gives a very accurate picture of the success of your business strategy.
- ARR per person: This indicator is linked to the second axis of scale. In the next chapter, we’ll see how important it is.
Good news: it is pretty easy to track those five corporate metrics, and it’s definitely worth having them constantly viewable by all your team members, so they remain focused on what matters most. On our dashboard, for example, the five key indicators appear in the first column. Each of these is broken down into six months. The large circle surrounding each number shows your progress toward.
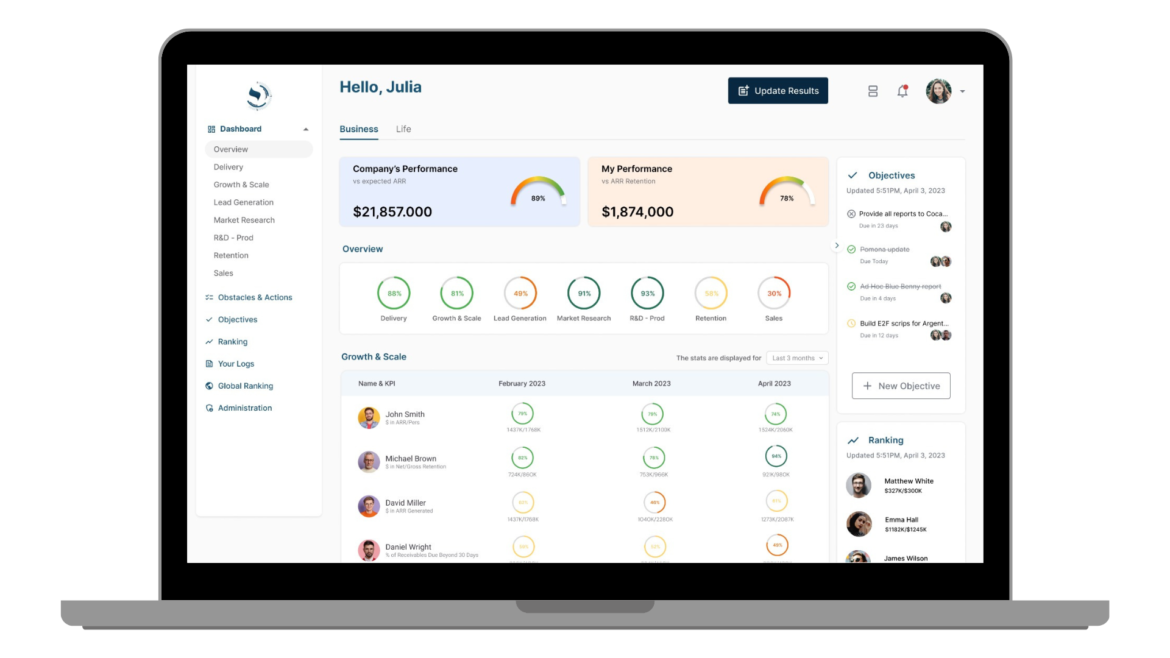
In our diagram, the first line corresponds to the monthly ARR. For May, you’ve made about $6 million. The monthly goal was $8 million. So, you are at 75% of that goal, and therefore only three-quarters of the circle is complete.
The dashboard allows you to see in the blink of an eye: is this lack of recurring revenue linked to difficulty with retention or to a low number of new contracts? In a single glance, you have the answer. The monthly new business objective has been reached (third line), while the retention circle is not complete (second line).
The progress compared to the previous year (year-to-date) is also added to each monthly figure. It is represented by a small circle listing the percentage of progress with an arrow pointing up for growth, down for a negative percentage, or up and down for stagnation.
You immediately see whether your profitability (EBIT) and productivity (ARR/person) are doing better or worse than the previous year.
A few numbers and symbols (large circles, small circles, and arrows) give you a clear insight into your business. Like a pilot in the cockpit, you are focused on your flight plan and the condition of your aircraft.
This first part of the dashboard gives you an overview and allows you to quickly identify the projects requiring your attention. To act effectively, you now need a more detailed view of every aspect of your business.
Some specific applications:
If EBIT figures do not meet your expectations
You will then examine the expenses. Are they all linked to the value creation cycle? (See Chapter 16 – Oiling the Organizational Machine) In other words, you need to cut all costs that are not directly used to retain existing customers or sign new contracts.
If customer retention is bad
Take a look at the relevant tab and identify at-risk customers. Assess their level of satisfaction and what they need from your com- pany to maintain the bond of trust. Always remember that retention is the branch you’re sitting on. You must tend to it.
If your retention is good, but ARR doesn’t take off
Maybe it’s time to get involved in the big business deals that are currently being handled by your sales team. You can probably turn them into licenses or multi-year contracts. Remember here that ARR is worth much more than a one-time contracts. It’s worth stepping into the arena to help your sales team transform a portion of their pipe.
If the level of new business is low
In the dashboard I use to lead a scale effort, you have also access to the revenue generated by product and by market. The value of, or even the need for, a strategic change will be obvious. You’ll know where to shift your focus geographically, which product generates the most cash, etc. At CHD, this dashboard was a great help to us the year we launched several innovations and integrated new markets. It has allowed us to focus on marketing the most profitable product and to reduce our efforts (and costs) in geographic areas with no added value.
Finally, it should be noted that this dashboard is not just a strategic tool. It’s also a great way to keep us and our employees fully focused on what matters most. Indeed, the five indicators mentioned are automatically fed by individual dashboards. Each team member thus has their own management tool. We’ll discuss this again in the last chapter. But before that, let’s take a look at an essential point: our role as CEO and measuring… our own performance!
— Lionel Benizri —